Statistics Definitions > Marginal Mean, Cell Mean
What is a Marginal Mean?
A marginal mean is (as the name suggests) a mean found in the margins (i.e. the edges) of a contingency table. In other words, it’s the average scores from a group or subgroup in an experiment. The more technical definition is that one factor’s marginal means are the means for the factors averaged for all levels of the other factors.
Example
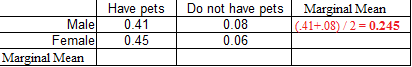
Question: What are the marginal means for the following two-way table showing the percentage of males/females who own pets?
![]()
Solution: The contingency table shows two factors: sex (male or female) and pet ownership status (has pets or does not have pets). Each of these factors has two “levels” (i.e. male/female or yes/no). Therefore you’ll need to find four marginal means:
- Male.
- Female.
- Pets.
- No pets.
As you can probably, tell, when it’s written out this way: each level in each factor will have a marginal mean. Another way to look at is is that each column and each row in a contingency table has an associated marginal mean.
1. Male
Take the average across the row:
(0.41 + 0.08) / 2 = 0.245.
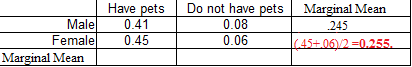
2. Female
Take the average across the row:
(0.45 + 0.06) / 2 = 0.255.
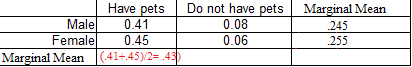
3. Pets
Take the average down the column:
(0.41 + 0.45) / 2 = 0.43.
4. No Pets
Take the average down the column:
(0.08 + 0.06) / 2 = 0.07.
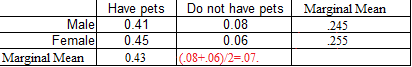
The bottom left column is left blank (taking the averages of all the averages is not necessary).
Cell Mean and Other Items in Contingency Tables
A cell mean is a count in a cell that represents a mean, instead of a total. “Cell mean” is an informal term, and there aren’t any hard and fast rules for differentiating it from anything else in a cell. If you’re reading a contingency table, you can probably figure out if you’ve got a cell mean from the context. If you’re making a table, you may want to make it clear if the counts are totals or means.
For example, the following image shows several numbers (..45, .41. .08 & .06).
![]()
It’s not clear from the image if these are counts or cell means (as they aren’t labeled). The implication is that 41% of men have pets, so you could interpret it as “on average, 41% of men have pets”. That would make it a cell mean.
Marginal totals also appear in the same place in a contingency table as marginal means (i.e. in the margins). To avoid confusing the two, make sure the margins are clearly labeled as means or totals.
Another item you might find in the margin is a marginal distribution.
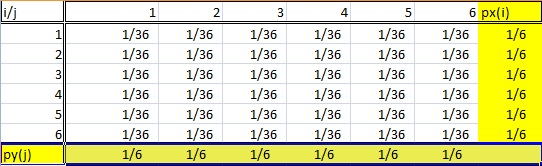
Marginal distributions relate to probabilities and bivariate data (for the full definition, see: What is a Marginal Distribution?). Again, the column should be clearly labeled as a probability distribution (e.g. p(x) ) to avoid confusions with totals and means.