What is the Mahalanobis distance?
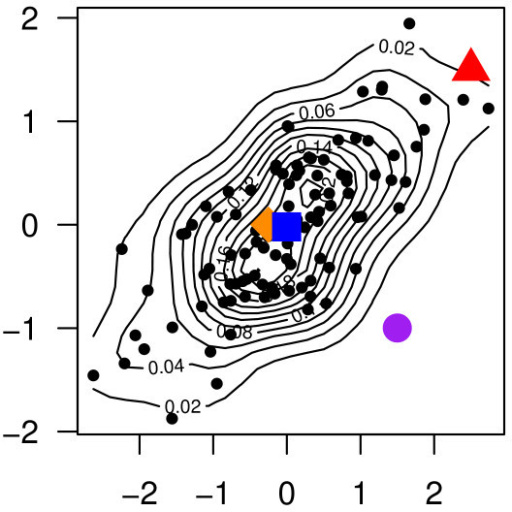
The Mahalanobis distance (MD) is the distance between two points in multivariate space. In a regular Euclidean space, variables (e.g. x, y, z) are represented by axes drawn at right angles to each other; The distance between any two points can be measured with a ruler. For uncorrelated variables, the Euclidean distance equals the MD. However, if two or more variables are correlated, the axes are no longer at right angles, and the measurements become impossible with a ruler. In addition, if you have more than three variables, you can’t plot them in regular 3D space at all. The MD solves this measurement problem, as it measures distances between points, even correlated points for multiple variables.

The Mahalanobis distance measures distance relative to the centroid — a base or central point which can be thought of as an overall mean for multivariate data. The centroid is a point in multivariate space where all means from all variables intersect. The larger the MD, the further away from the centroid the data point is.
Uses
The most common use for the Mahalanobis distance is to find multivariate outliers, which indicates unusual combinations of two or more variables. For example, it’s fairly common to find a 6′ tall woman weighing 185 lbs, but it’s rare to find a 4′ tall woman who weighs that much.
Formal Definition
The Mahalanobis distance between two objects is defined (Varmuza & Filzmoser, 2016, p.46) as:
d (Mahalanobis) = [(xB – xA)T * C -1 * (xB – xA)]0.5
Where:
xA and xB is a pair of objects, and
C is the sample covariance matrix.
Another version of the formula, which uses distances from each observation to the central mean:
d
Where:
xi = an object vector
x̄ = arithmetic mean vector
Related Measurements
A related term is leverage, which uses a different measurement scale than the Mahalanobis distance. The two are related by the following formula (Weiner et. al, 2003):
Mahalanobis distance = (N – 1) (Hii – 1/N)
Where hii is the leverage.
While the MD only uses independent variables in its calculations, Cook’s distance uses both the independent and dependent variables. It is a product of the leverage and the standardized residual.
Disadvantages
Although Mahalanobis distance is included with many popular statistics packages, some authors question the reliability of results (Egan & Morgan, 1998; Hadi & Simonoff, 1993).
A major issue with the MD is that the inverse of the correlation matrix is needed for the calculations. This can’t be calculated if the variables are highly correlated (Varmuza & Filzmoser, 2016).
References
Egan, W. & Morgan, S. (1998). Outlier detection in multivariate analytical chemical data. Analytical Chemistry, 70, 2372-2379.
Hadi, A. & Simonoff, J. (1993). Procedures for the identification of multiple outliers in linear models. Journal of the American Statistical Association, 88, 1264-1272.
Hill, T. et. al. (2006). Statistics: Methods and Applications : a Comprehensive Reference for Science, Industry, and Data Mining. Statsoft, Inc.
Varmuza, K. & Filzmoser, P. Introduction to Multivariate Statistical Analysis in Chemometrics. CRC Press
Weiner, I. et. al. (2003). Handbook of Psychology, Research Methods in Psychology. John Wiley & Sons.