What is the Likert Scale?
- Strongly agree
- Agree
- Neutral
- Disagree
- Strongly disagree
Five to seven items are usually used in the scale. The scale doesn’t have to state “agree” or “disagree”; dozens of variations are possible on themes like agreement, frequency, quality and importance. For example:
- Agreement: Strongly agree to strongly disagree.
- Frequency: Often to never.
- Quality: Very good to very bad.
- Likelihood: Definitely to never.
- Importance: Very important to unimportant.
These items are called Likert Scale Response Anchors.
Once the respondents have answered, numbers are assigned to the responses. For example:
Strongly agree=5
Agree=4
Neutral=3
Disagree=2
Strongly disagree=1
This enables you to assign meaning to the responses. For example, a survey on customer service can enable you to see which of your customer service representatives are providing good service (an average score of 4-5) and which are providing poor service (an average score of 1-2).
Steps to Developing a Likert Scale
- Define the focus: what is it you are trying to measure? Your topic should be one-dimensional. For example “Customer Service” or “This Website.”
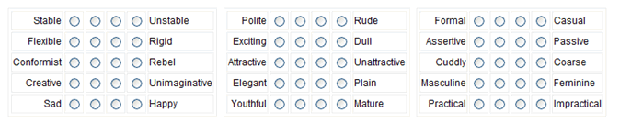
- Generate the Likert Scale items. The items should be able to be rated on some kind of scale. The image at the top of this page has some suggestions. For example, polite/rude could be rated as “very polite”, “polite”, “not polite” or “very impolite.” Politeness could also be rated on a scale of 1 to 10, where 1 is not polite at all and 10 is extremely polite.
- Rate the Likert Scale items. You want to be sure your focus is good, so pick a team of people to go through the items in step 2 above and rate them as favorable/neutral/unfavorable to your focus. Weed out the items that are mostly seen as unfavorable.
- Administer your Likert Scale test.
Hypothesis Tests on Likert Scales
If you known that you’re going to be performing analysis on Likert scale data, it’s easier to tailor your questions in the development stage, rather than to collect your data and then make a decision about analysis. What analysis you run depends on the format of your questionnaire.
There is some disagreement in education and research about whether you should run parametric tests like the t-test or non-parametric hypothesis tests like the Mann-Whitney on Likert-scale data. Winter and Dodou(2010) researched this issue, with the following results:
“In conclusion, the t test and [Mann-Whitney] generally have equivalent power, except for skewed, peaked, or multimodal distributions for which strong power differences between the two tests occurred. The Type I error rate of both methods was never more than 3% above the nominal rate of 5%, even not when sample sizes were highly unequal.”
In other words, there seems to be no real difference between the results for parametric and non-parametric tests, except for skewed, peaked, or multimodal distributions. Which avenue you take is up to you, your department, and perhaps the journal you are submitting to (if any). The most important step at the decision stage is deciding if you want to treat your data as ordinal or interval data. Then read the section below for your data type. A couple of general guidelines:
- For a series of individual questions with Likert responses, treat the data as ordinal variables.
- For a series of Likert questions that together describe a single construct (personality trait or attitude), treat the data as interval variables.
Two Options
Most Likert scales are classified as ordinal variables. If you are 100% sure that the distance between variables is constant, then they can be treated as interval variables for testing purposes. In most cases, your data will be ordinal, as it’s impossible to tell the difference between, say, “strongly agree” and “agree” vs. “agree” and “neutral.”
Ordinal Scale Data
With most variable types (interval, ratio, nominal), you can find the mean. This is not true for Likert scale data. The mean in a Likert scale can’t be found because you don’t know the “distance” between the data items. In other words, while you can find an average of 1,2, and 3, you can’t find an average of “agree”, “disagree”, and “neutral.”
“The average of ‘fair’ and ‘good’ is not ‘fair‐and‐a‐half’; which is true even when one assigns integers to represent ‘fair’ and ‘good’!” – Susan Jamieson paraphrasing Kuzon Jr et al. (Jamieson, 2004)
Statistics Choices
Statistics you can use are:
- The mode: the most common response.
- The median: the “middle” response when all items are placed in order.
- The range and interquartile range: to show variability.
- A bar chart or frequency table: to show a table of results. Do not make a histogram, as the data is not continuous.
Hypothesis Testing
In hypothesis testing for Likert scales, the independent variable represents the groups and the dependent variable represents the construct you are measuring. For example, if you survey nursing students to measure their level of compassion, the independent variable is the groups of nursing students and the dependent variable is the level of compassion.
Types of test you can run:
- Kruskal Wallis: determines if the median for two groups is different.
- Mann Whitney U Test: determines if the medians for two groups are different. Simple to evaluate single Likert scale questions, but suffers from several forms of bias, including central tendency bias, acquiescence bias and social desirability bias. In addition, validity is usually hard to demonstrate.
More Options for Two Categories
If you combine your responses into two categories, for example, agree and disagree, more test options open up to you.
- Chi-square: The test is designed for multinomial experiments, where the outcomes are counts placed into categories.
- McNemar test: Tests if responses to categories are the same for two groups/conditions.
- Cochran’s Q test: An extension of McNemar that tests if responses to categories are the same for three or more groups/conditions.
- Friedman Test: for finding differences in treatments across multiple attempts.
Measures of Association
Sometimes you want to know if a one group of people has a different response (higher or lower) from another group of people to a certain Likert scale item. To answer this question, you would use a measure of association instead of a test for differences (like those listed above).
If your groups are ordinal (i.e. ordered) in some way, like age-groups, you can use:
- Kendall’s tau coefficient or variants of tau (e.g., gamma coefficient; Somers’ D).
- Spearman rank correlation.
If your groups aren’t ordinal, then use one of these:
Interval Scale Data
Statistics that are suitable for interval scale Likert data:
- Mean.
- Standard deviation.
Hypothesis Tests suitable for interval scale Likert data:
- T-test.
- ANOVA.
- Regression analysis (either ordered logistic regression or multinomial logistic regression). If you can combine your dependent variables into two responses (e.g. agree or disagree), run binary logistic regression.
References
Beyer, W. H. CRC Standard Mathematical Tables, 31st ed. Boca Raton, FL: CRC Press, pp. 536 and 571, 2002.
Levine, D. (2014). Even You Can Learn Statistics and Analytics: An Easy to Understand Guide to Statistics and Analytics 3rd Edition. Pearson FT Press
Vogt, W.P. (2005). Dictionary of Statistics & Methodology: A Nontechnical Guide for the Social Sciences. SAGE.
Salkind, N. (2016). Statistics for People Who (Think They) Hate Statistics: Using Microsoft Excel 4th Edition.