Factor Analysis > Kaiser-Meyer-Olkin (KMO) Test
What is the Kaiser-Meyer-Olkin (KMO) Test?
The Kaiser-Meyer-Olkin (KMO) Test is a measure of how suited your data is for Factor Analysis. The test measures sampling adequacy for each variable in the model and for the complete model. The statistic is a measure of the proportion of variance among variables that might be common variance. The lower the proportion, the more suited your data is to Factor Analysis.
KMO returns values between 0 and 1. A rule of thumb for interpreting the statistic:
- KMO values between 0.8 and 1 indicate the sampling is adequate.
- KMO values less than 0.6 indicate the sampling is not adequate and that remedial action should be taken. Some authors put this value at 0.5, so use your own judgment for values between 0.5 and 0.6.
- KMO Values close to zero means that there are large partial correlations compared to the sum of correlations. In other words, there are widespread correlations which are a large problem for factor analysis.
For reference, Kaiser put the following values on the results:
- 0.00 to 0.49 unacceptable.
- 0.50 to 0.59 miserable.
- 0.60 to 0.69 mediocre.
- 0.70 to 0.79 middling.
- 0.80 to 0.89 meritorious.
- 0.90 to 1.00 marvelous.
Running the Kaiser-Meyer-Olkin (KMO) Test
The formula for the KMO test is:
![]()
where:
- R = [rij] is the correlation matrix,
- U = [uij] is the partial covariance matrix,
- Σ = summation notation (“add up”).
This test is not usually calculated by hand, because of the complexity.
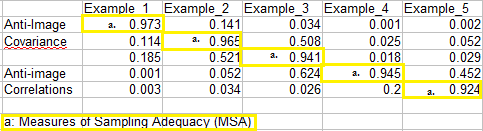
- In SPSS: Run Factor Analysis (Analyze>Dimension Reduction>Factor) and check the box for”KMO and Bartlett’s test of sphericity.” If you want the MSA (measure of sampling adequacy) for individual variables, check the “anti-image” box. An anti-image box will show with the MSAs listed in the diagonals.
The test can also be run by specifying KMO in the Factor Analysis command. The KMO statistic is found in the “KMO and Bartlett’s Test” table of the Factor output. - In R: use the command KMO(r), where r is the correlation matrix you want to analyze. Find more details about the command in R on the Personality-Project website.
- In Stata, use the post estimation command estat kmo.
References
Dodge, Y. (2008). The Concise Encyclopedia of Statistics. Springer.
Gonick, L. (1993). The Cartoon Guide to Statistics. HarperPerennial.
Klein, G. (2013). The Cartoon Introduction to Statistics. Hill & Wamg.
Vogt, W.P. (2005). Dictionary of Statistics & Methodology: A Nontechnical Guide for the Social Sciences. SAGE.