What is Inferential Statistics?
Watch the video for a brief overview of the difference between inferential statistics and descriptive statistics:
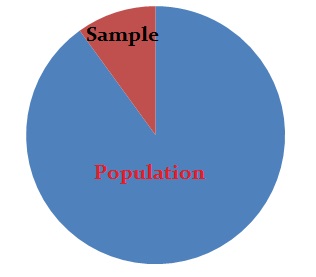
Descriptive statistics describes data (for example, a chart or graph) and inferential statistics allows you to make predictions (“inferences”) from that data. With inferential statistics, you take data from samples and make generalizations about a population.
For example, you might stand in a mall and ask a sample of 100 people if they like shopping at Sears. You could make a bar chart of yes or no answers (that would be descriptive statistics) or you could use your research (and inferential statistics) to reason that around 75-80% of the population (all shoppers in all malls) like shopping at Sears.
There are two main areas of inferential statistics:
- Estimating parameters. This means taking a statistic from your sample data (for example the sample mean) and using it to say something about a population parameter (i.e. the population mean).
- Hypothesis tests. This is where you can use sample data to answer research questions. For example, you might be interested in knowing if a new cancer drug is effective. Or if breakfast helps children perform better in schools.
Let’s say you have some sample data about a potential new cancer drug. You could use descriptive statistics to describe your sample, including:
- Sample mean
- Sample standard deviation
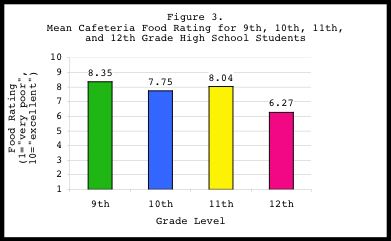
- Making a bar chart or boxplot
- Describing the shape of the sample probability distribution
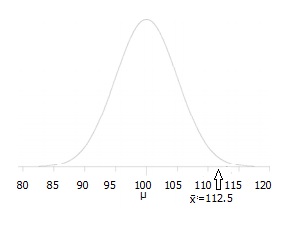
With inferential statistics you take that sample data from a small number of people and try to determine if the data can predict whether the drug will work for everyone (i.e. the population). There are various ways you can do this, from calculating a z-score (z-scores are a way to show where your data would lie in a normal distribution to post-hoc (advanced) testing.
Inferential statistics use statistical models to help you compare your sample data to other samples or to previous research. Most research uses statistical models called the Generalized Linear model and include Student’s t-tests, ANOVA (Analysis of Variance), regression analysis and various other models that result in straight-line (“linear“) probabilities and results.
Inferential Statistics Articles
You can find hundreds of inferential statistics articles and videos on this site and on our YouTube channel. The main indexes for inferential statistics articles are:
- Binomial Theorem
- Hypothesis Testing
- Normal Distributions
- T-Distributions
- Central Limit Theorem
- Confidence Intervals
- Regression Analysis / Linear Regression
- Comparison of Means.
Related Articles
References
Gonick, L. The Cartoon Guide to Statistics. 1993.