TI 89 for Statistics > Binomial Probability TI 89
Binomial Probability TI 89 Overview
 The TI-89 Titanium graphing calculator is a powerful, hand held calculator that can plot graphs, make bar graphs, and calculate just about anything related to probability and statistics. It’s possible to calculate binomial probabilities by hand, the TI-89 graphing calculator will save you about thirty minutes of time working out the problem. Once you’ve got the hang of entering the binomial probability numbers into the TI-89, you’ll wonder how you ever did without it.
The TI-89 Titanium has an add-on that you can use for a variety of statistics topics: the Stats/List editor. If you don’t have it on yours, you can download it for free here. In the Stats/List editor, you can enter the number of times an event occurs, plug in a probability, and get the mean and standard deviation for a binomial distribution a millisecond later.
Binomial Probability TI 89 Contents:
Note: There are two options for calculating binomial probability; The BinomCDF will calculate multiple values for X (for example, less or greater than a certain number, or between two x-values). If you only have one x-value (i.e. X = 3 or X = 6), use BinomPDF. If you aren’t sure of whether you want to use BinomPDF or BinomCDF, I explain the difference here: What is the difference between BinomPDF and BinomCDF? It’s a TI 83 article but the functions do the exact same thing.
Binomial Probability TI 89: BinomPDF
Example problem: John’s batting average is .240. If he’s at bat three times, what is the probability that he gets exactly three hits?
Step 1: Press the APPS key and scroll (using the scrolling arrows) to choose Stats/List Editor. Press ENTER.
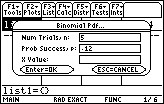
Step 2: Press the F5 key. Scroll down to B: Binomial Pdf. Press ENTER.
Step 3: Enter the number of trials. John bats three times, so the number of trials is 3. Press 3 and hit the down arrow key.
Step 4: Enter the Probability of Success, P. John’s batting average is .240, so enter .240. hit the down arrow key.
Step 5: Enter the X value. We want to know the probability of John getting exactly three hits, so type 3 in the X Value box.
Step 6: Press ENTER for the result. The probability of John getting exactly three hits is .013824, returned at the top of the screen as “Pdf=.013824“.
Tip #1: Instead of scrolling down to Binomial PDF, you can hit the ALPHA and ( keys to select it instead.
Binomial Probability TI 89: BinomCDF
Note: Make sure you have the Stats/List editor installed, otherwise you won’t be able to access the function.
Example problem: Jane’s batting average is .230. If she’s at bat four times, what is the probability that she gets three or four hits?
Step 1: Press APPS and use the scroll arrows to highlight the Stats/List Editor. Press ENTER.
Step 2: Press F5. Press ALPHA and ). This should bring up the BinomCdf screen. If it doesn’t, make sure you pressed down the ALPHA key (you are using it to choose “C” above the “)” key).
Step 3: Enter the number of trials in the Num Trials box. Jane goes to bat four times, so the number of trials is 4. Press 4 and then the down arrow key.
Step 4: Enter the probability: “Prob Success, p.” Jane’s batting average is .230, so enter .230 in this box. Press the down arrow key.
Step 5: Enter the lower value, 3. You want to know the probability of Jane getting between three and four hits, so you enter 3 in the X Value box.
Step 6: Enter the upper value, 4.
Step 7: Press ENTER twice for the result. The probability of Jane getting three or four hits is .040273, returned at the top of the screen as “Pdf=.040273“.
Tip: Instead hitting the Alpha and ) keys to select BinomialCdf, you can scroll down the menu with the arrow keys instead.
Warning: Make sure you’re choosing the right function (BinomCDF or BinomPDF). Use the BinomialPdf function (option B from the F5 menu) if you only have one x-value.
TI-89 Mean and Standard Deviation for a Binomial Distribution: Steps
Example problem: Find the mean and standard deviation for a binomial distribution with n = 5 and p = 0.12.
Step 1: Press APPS and select the Stats/List Editor. Press ENTER. (Download page for stats/list editor).
Step 2: Press F1 and then 8 to clear the list editor.
Step 3: Name the first column “BIN” by entering 2nd Alpha (for alpha lock) then (9 6. Press Enter.
Step 4: Enter the following into column 1:
0 ENTER
1 ENTER
2 ENTER
3 ENTER
4 ENTER
5 ENTER
Step 5: Press F5 and scroll down to BinomialPdf (option B). Press Enter.
Step 6: Enter 5 into the Num Trials, n box.
Step 7: Scroll down and enter .12 into the Prob Success, p box.
Step 8: Scroll down and delete anything in the X box to leave a blank value. Press Enter.
Step 9: Press Enter again. The BinomialPdf values are entered into a list title “PDF.”
Step 10: Press F4 Enter. Type “bin” into the “List” box using the same keystrokes from step 3.
Step 11: Type “statvars\pdf” into the Freq box. How? press 2nd Alpha (to lock the keys), then 3 T = T 0 = 2 2nd 2 2nd Alpha (to lock again) sto› , |.
Step 12: Press Enter and read the result. The mean (the top value, an x with a bar on top) is .06. The standard deviation is .243475 and is the fifth line down (σx).
Tip: If you get an error like “argument mismatch,” check your inputs in the 1-var stats box to make sure they say “bin” and “statvars\pdf” without the quotes.
Lost your guidebook? You can download a new one from the TI website here.
Comments are closed.