Critical Values > Critical Chi-Square Value
Critical Chi-Square Value: Overview
Watch the video for an overview of the chi-square test, or read on below if you want to skip to finding the critical chi-square value.
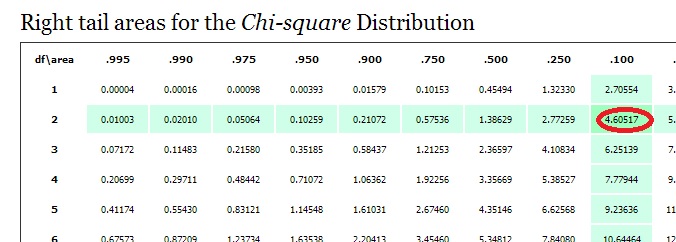
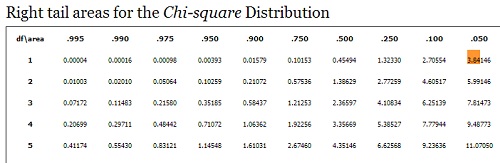
The chi-square statistic is used to compare two categorical variables to see if they are related. Calculating the statistic involves looking the figure up in the chi-square table. The chi-square table is similar to other distribution tables; You need a couple of pieces of information to look up the statistic. In the case of chi-square, you’ll need to know degrees of freedom and probability (both of which are usually supplied in the question).
Watch the video for an example of how to read the chi-square table:
Need help? Check out our tutoring page!
Critical Chi-Square Value: Steps
Example question: You hold an experiment for an agricultural firm. They want to find out if there might be a link between hybrids (cross strains of plants) and the number of deviations (i.e. unexpected or unwanted plants) that show up. The firm has two types of corn it is crossing: blue and yellow corn. Most biologists agree that deviations with a chance probability of more than 5% are not statistically significant. Find the critical chi-square value.
Step 1: Calculate the number of degrees of freedom. This number may be given to you in the question. If it isn’t then the degrees of freedom equals the number of classes (categories) minus one. In the sample question, you have two categories: blue corn and yellow corn. Therefore the degrees of freedom = 2-1 = 1.
Step 2: Find the probability that the phenomenon you are investigating would occur by chance. This is usually stated in the question. In the sample question, you are given the probability of 5%, or 0.05.
Step 3: Look up degrees of freedom and probability in the chi-square table. One degree of freedom and 5 percent probability equals 3.84 in the chi-square table. This is your critical chi-square value.
Tip: A small chi-square value means that there is very little relationship between your two variables. A larger value means that there is a greater relationship between your two variables.
Check out our YouTube channel for more stats tips!
References
Kenney, J. F. and Keeping, E. S. Mathematics of Statistics, Pt. 2, 2nd ed. Princeton, NJ: Van Nostrand, 1951.