Time Series Analysis > Exponential Smoothing
Contents:
What is Exponential Smoothing?
Exponential Smoothing in Excel 2016-2013
What is Exponential Smoothing?
Exponential smoothing of time series data assigns exponentially decreasing weights for newest to oldest observations. In other words, the older the data, the less priority (“weight”) the data is given; newer data is seen as more relevant and is assigned more weight. Smoothing parameters (smoothing constants)— usually denoted by α— determine the weights for observations.
Exponential smoothing is usually used to make short term forecasts, as longer term forecasts using this technique can be quite unreliable.
- Simple (single) exponential smoothing uses a weighted moving average with exponentially decreasing weights.
- Holt’s trend-corrected double exponential smoothing is usually more reliable for handling data that shows trends, compared to the single procedure.
- Triple exponential smoothing (also called the Multiplicative Holt-Winters) is usually more reliable for parabolic trends or data that shows trends and seasonality..
1. Simple Exponential Smoothing
The basic formula is:
St = αyt-1 + (1 – α) St-1
Where:
- α = the smoothing constant, a value from 0 to 1. When α is close to zero, smoothing happens more slowly. Following this, the best value for α is the one that results in the smallest mean squared error (MSE). Various ways exist to do this, but a popular method is the Levenberg–Marquardt algorithm.
- t = time period.
Many alternative formulas exist. For example, Roberts (1959) replaced yt-1 with the current observation, yt. Another formula uses the forecast for the previous period and current period:
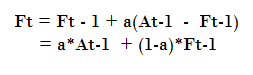
Where:
- Ft – 1 = forecast for the previous period,
- At – 1 = Actual demand for the period,
- a = weight (between 0 and 1). The closer to zero, the smaller the weight.
Which formula to use is usually a moot point, as most exponential smoothing is performed using software. Whichever formula you use though, you’ll have to set an initial observation. This is a judgment call. You could use an average of the first few observations, or you could set the second smoothed value equal to the original observation value to get the ball rolling.
2. Double Exponential Smoothing
This method is deemed more reliable for analyzing data that shows a trend. In addition, this is a more complicated method which adds a second equation to the procedure:
bt = γ(St – St-1) + (1 – γ)bt-1
Where:
- γ is a constant that is chosen with reference to α. Like α it can be chosen through the Levenberg–Marquardt algorithm.
3. Triple Exponential Smoothing
If your data shows a trend and seasonality, use triple exponential smoothing. In addition to the equations for single and double smoothing, a third equation is used to handle the seasonality aspect:
It = Β yt/St + (1-Β)It-L+m
Where:
- y = observation,
- S = smoothed observation,
- b = trend factor,
- I = seasonal index,
- F = forecast m periods ahead,
- t = time period.
Like α and γ, the optimal Β minimizes the MSE.
Exponential Smoothing in Excel 2016 & 2013
Watch the video or read the steps below:
Exponential Smoothing in Excel 2016 & 2013: Overview
 Exponential smoothing is a way to smooth out data for presentations or to make forecasts. It’s usually used for finance and economics. If you have a time series with a clear pattern, you could use moving averages — but if you don’t have a clear pattern you can use exponential smoothing to forecast.
Damping Factors
Perhaps one of the most confusing aspects of exponential smoothing is the damping factor. Damping factors are used to smooth out the graph and take on a value between 0 and 1. Technically, the damping factor is 1 minus the alpha level (1 – α). But all you really need to know is smaller alpha levels (i.e. larger damping factors), smooths out the peaks and valleys more than larger alpha levels (smaller damping factors). Smaller damping factors also mean that your smoothed values are closer to the actual data points than larger damping factors. The easiest way to create exponential smoothing in Excel is to use the Data Analysis Toolpak.
Exponential Smoothing in Excel 2016 & 2013: Steps
Step 1: Click the “Data” tab and then click “Data Analysis.”
Step 2: Select “Exponential Smoothing” and then click “OK.”
Step 3: Click the Input Range box and then type the location for your forecast data. For example, if you typed your data into cells E1 to E10, type “E1:E10” into that box
Step 4: Type a damping factor into the damping factor box. A valid value is 0 to 1. Don’t worry if you aren’t sure what damping factor to type in>you can easily repeat the tests with different damping factors (i.e. 0.9, 0.5, 0.3) to see which one works best.
Step 5: Type a cell location into the Output range box. You generally want this in the next column. For example, if you typed your data into cells E1 to E10, type “F1” into that box
Step 6: Click “OK.”
The following graph shows the original data set (first column of data), and what happens when a damping factor is applied:
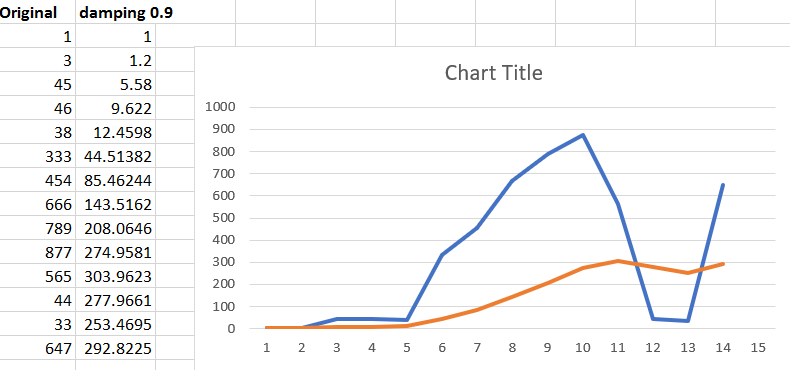
Check out our YouTube channel for more Excel help and tips!
References
Agresti A. (1990) Categorical Data Analysis. John Wiley and Sons, New York.
Gonick, L. (1993). The Cartoon Guide to Statistics. HarperPerennial.
Kotz, S.; et al., eds. (2006), Encyclopedia of Statistical Sciences, Wiley.
Wheelan, C. (2014). Naked Statistics. W. W. Norton & Company