Statistics Definitions > Dispersion
What is Dispersion?
Dispersion in statistics is a way of describing how spread out a set of data is. When a data set has a large value, the values in the set are widely scattered; when it is small the items in the set are tightly clustered. Very basically, this set of data has a small value:
1, 2, 2, 3, 3, 4
…and this set has a wider one:
0, 1, 20, 30, 40, 100
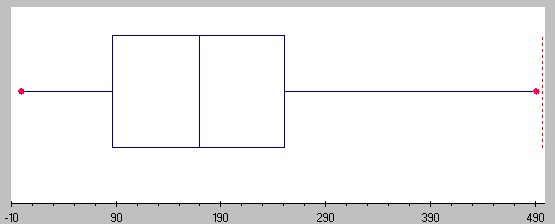
The spread of a data set can be described by a range of descriptive statistics including variance, standard deviation, and interquartile range. Spread can also be shown in graphs: dot plots, boxplots, and stem and leaf plots have a greater distance with samples that have a larger dispersion and vice versa.
Measures of Dispersion.
- Coefficient of dispersion: A “catch-all” term for a variety of formulas, including distance between quartiles.
- Standard deviation: probably the most common measure. It tells you how spread out numbers are from the mean,
- Index of Dispersion: a measure of dispersion commonly used with nominal variables.
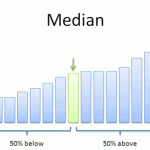
- Interquartile range (IQR): describes where the bulk of the data lies (the “middle fifty” percent).
- Interdecile range: the difference between the first decile (10%) and the last decile (90%).
- range : the difference between the smallest and largest number in a set of data.
- Mean difference or difference in means: measures the absolute difference between the mean value in two different groups in clinical trials.
- Median absolute deviation (MAD): the median of the absolute deviations from a data set’s median.
- Quartiles: Numbers that split the data into four quarters (first, second, third, and fourth quartiles).
In some processes, like manufacturing or measurement, low dispersion is associated with high precision. High dispersion is associated with low precision.
Measures of Dispersion: Example
Let’s say you were asked to compare measures of dispersion for two data sets. Data set A has the items 97,98,99,100,101,102,103 and data set B has items 70,80,90,100,110,120,130. By looking at the data sets you can probably tell that the means and medians are the same (100) which technically are called “measures of central tendency” in statistics.
However, the range (which gives you an idea of how spread out the entire set of data is) is much larger for data set B (60) when compared to data set A (6). In fact, nearly all measures of dispersion would be ten times greater for data set B, which makes sense as the range is ten times larger. For example, take a look at the standard deviations for the two data sets:
Standard deviation for A: 2.160246899469287.
Standard deviation for B: 21.602468994692867.
The figure for data set B is exactly ten times that of A.
Warning: When using a calculator (or a formula), check to make sure you are using the correct setting (or formula) for your data. Many measures of dispersion (like the variance) have two different formulas, one for a population and one for a sample. If you aren’t sure if you have a sample or a population, read these articles:
What is a population in statistics?
Sample in statistics: What it is, how to find it.
Check out our statistics YouTube channel. Hundreds of basic videos for an array of elementary statistics topics.
References
Beyer, W. H. CRC Standard Mathematical Tables, 31st ed. Boca Raton, FL: CRC Press, pp. 536 and 571, 2002.
Kotz, S.; et al., eds. (2006), Encyclopedia of Statistical Sciences, Wiley.
Levine, D. (2014). Even You Can Learn Statistics and Analytics: An Easy to Understand Guide to Statistics and Analytics 3rd Edition. Pearson FT Press
Salkind, N. (2016). Statistics for People Who (Think They) Hate Statistics: Using Microsoft Excel 4th Edition.