Measures of Dispersion > Coefficient of Dispersion
What is a Coefficient of Dispersion (COD)?
The term “coefficient of dispersion” can mean a few different things in statistics. There isn’t one formula or definition that is universal. Everything depends on the context of where you’re using the coefficient and what you want to do with it:
- Informally, some people use “coefficient of dispersion” interchangeably with “Coefficient of Variation”.
- The Karl Pearson Coefficient of dispersion is simply the ratio of the standard deviation to the mean.
- Green’s COD (Cx) is suitable when dealing with densities. The formula is: sample variance/sample mean – 1/Σ(x-1).
- As a measure of dispersion around a median, you can use the formula:
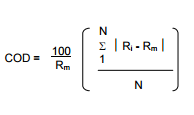
Where:
Rm = median ratio;
Ri = observed ratio.
N = number in the sample.
This is almost exclusively used to deal with property and market values. For solution steps, see this New York State government sheet. - The Quartile Coefficient of Dispersion (see below), which is one of the more popular versions of COD found in research.
What is a Quartile Coefficient of Dispersion?
The quartile coefficient of dispersion) is a measure of the spread of a data set. The formula is:

Where:
- Q1 is the first quartile,
- Q3 is the third quartile.
The CoD tells you how spread out data sets are relative to each other. For example, if one data set has a CoD of 0.5 and another has a CoD of 0.10, then data set 1 is 5 times as great (0.5/0.10) as data set 2.
Example
What is the quartile coefficient of dispersion for the following set of numbers?
2, 4, 6, 8, 10, 12, 14
Step 1 :Find the 25th percentile (Q1) and the 75th percentile (Q3). There are a few ways you can do this. One of the easiest ways is to use our interquartile range calculator. By hand, see: Finding Quartiles.
Plugging the data set into the calculator, we get:
- Q1 = 25th percentile = 4
- Q2 = 75th percentile = 12.
Step 2 :Plug the numbers from Step 1 into the formula and solve:
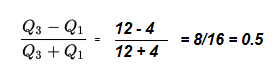
The coefficient of dispersion for this data set is 0.5.
References:
Bonett, D. G. (2006). Confidence interval for a coefficient of quartile variation. Computational Statistics & Data Analysis. 50 (11): 2953–2957
Green, R. (1966). Measurements of non-randomness in spatial distribution. Res. Popul. Ecol. 8:1-7.
M. Kendall and A. Stuart, The advanced theory of Statistics, Vol. 1, 4th Edition, Charles Grifin and Co.
London, (1977).