Statistics Definitions > Clustering / Cluster Analysis
What is Clustering?
Clustering in statistics refers to how data is gathered (“clustered”) by factors like:
- Age.
- Household size.
- Income.
- Or education level.
Sorting data into clusters sometimes leads to more investigation into the data. For example, cancer clusters can indicate some problem in the environment. Or, they can just be a result of the nature being random. Cluster Analysis tends to be subjective in many cases; it depends on what you perceive as common threads in the data. The technique isn’t really anything new in statistics; if you’ve ever made a bar graph, you’ve probably already made clusters (even if you didn’t call it that). For example, a bar graph showing breeds of dog requires you to cluster by breed (Siberian Husky, Border Collie, German Shepherd…) or a chart of income levels might be clustered by low, middle and high income levels.
Clusters can be based on factors like:
- Distance-based clustering. Items are sorted based on their proximity (or distance). For example, cancer cases might be clustered together if they are in the same geographic location.
- Conceptual clustering. Items are grouped by factors that items have in common. For example, cancer clusters could be grouped by “people who work in manufacturing.”
Clustering Types
- Exclusive Clustering. Each item can only belong in a single cluster. It cannot belong in another cluster.
- Fuzzy clustering: Data points are assigned a probability of belonging to one or more clusters.
- Overlapping Clustering. Each item can belong to more than one cluster.
- Hierarchical Clustering. This is a more complex approach to clustering used in data mining. Basically, each item is given its own cluster. A pair of clusters is joined based on similarities, giving one less cluster. This process is repeated until all items are clustered. The dendrogram is a graph that shows hierarchical clusters.
- Probabilistic Clustering. Data is clustered using algorithms which connect items using distances or densities. This is usually performed by a computer.
- Ward’s method: uses minimum variance in each step to create relatively small, even-sized clusters.
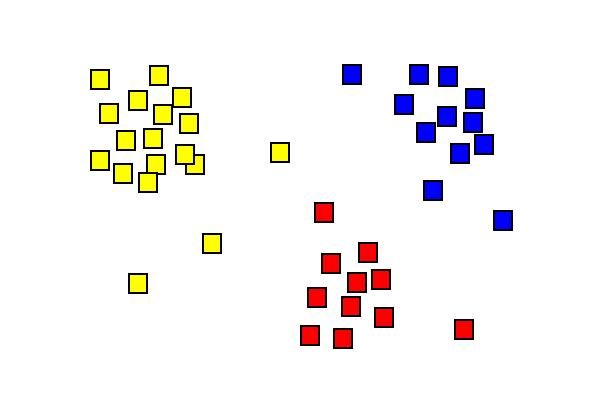
K Means Clustering
Clustering is just a way to group a set of data into smaller sets. The two ways you could group a set of data are quantitatively (using numbers) and qualitatively (using categories). For example, books on Amazon.com are listed both by category (qualitative) and by best seller (quantitative). K-Means clustering is one of the simplest unsupervised learning algorithms that solves clustering problems using a quantitative method: you pre-define a number of clusters and employ a simple algorithm to sort your data. That said, “simple” in the computing world doesn’t equate to simple in real life. This is actually an NP-hard problem, so you’ll want to use software for K-means clustering. Some programs that will perform this for you (click the link for the procedure) are:
The general steps behind the K-means clustering algorithm are:
- Decide how many clusters (k).
- Place k central points in different locations (usually far apart from each other).
- Take each data point and place it close to the appropriate central point. Repeat until all data points have been assigned.
- Re-calculate k new central points as barycenters.
- Repeat the assigning of data points, this time to the new central point (the barycenter).
- Repeat 4 and 5 until the central points (barycenters) do not move any more.
K-Means Clustering: A more Formal Definition
A more formal way to define K-Means clustering is to categorize n objects into k(k>1) pre-defined groups. The goal is to minimize the distance from each data point to the cluster. In other words, to find:
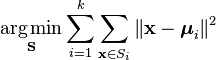
where:
X is a data point
k is the number of clusters
ui is the mean of the points in Si.
Cluster Analysis vs. Discriminant Analysis
Cluster analysis is very similar to discriminant analysis. Both methods involves separation into groups. However, cluster analysis is a way to identify the groups, while discriminant analysis requires you to know the groups before you begin analysis. For example, let’s say you had a group of psychiatric patients with abnormal behaviors. Cluster analysis could help you find distinct groups, like patients with a history of abuse, those with PTSD, or those experiencing hallucinations. If you were to run discriminant analysis on the same group of people, you must know the patients’ diagnoses before you start placing them into groups.
Clustering in Excel
Microsoft Excel has a data mining add-in for making clusters. The wizard works with Excel tables, ranges or Analysis Survey Queries. This add-in can be customized, unlike the Detect Categories tool. In addition, the Detect Categories tool is limited to data from tables.
To use:
- Download and install the Data Mining Add-in.
- Click “Data Mining,” then click “Cluster,” then “Next.”
- Tell Excel where your data is. For example, select a range of data. The clustering page will become available.
- Clustering: leave as is for automatic grouping, or you can specify a number of groups.
- Segments: leave as is for automatic grouping, or specify a number of categories.
- Deselect any columns that are not useful inputs for your analysis. For example, you may want to deselect ID numbers, birth dates or other identifiers.
- Tell Excel how much data to hold out for testing (on the Split data into training and testing page). The default is 30% testing/70% training.
- Give your model a name. Check the “Browse” option to immediately see your results.