Descriptive Statistics > How to Choose Bin Sizes in Statistics
Contents:
What is a Bin in statistics? Overview
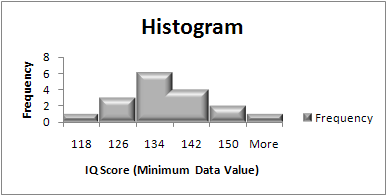
In statistics, data is usually sorted in one way or another. You might sort the data into classes, categories, by range or placement on the number line. A bin—sometimes called a class interval—is a way of sorting data in a histogram. It’s very similar to the idea of putting data into categories.
What is a bin in statistics: Why not use “Categories” instead of Class Intervals?
When you put data into categories, you’re putting them into those categories without any thoughts about how that data might tell you something. Basic sorting into categories like male/female or yes/no does exist in statistics, but when it comes to making a histogram you’re aiming to make a chart that tells you some very good information about how your data is spread out. Therefore you want to carefully choose categories/classes. You can think of a bin as being a physical bin where you might sort objects into.
Imagine you’re working in a clothing store and want to know which shoe items is most popular in your inventory. If you only fill one bin, your bin might end up overflowing pretty fast and you’d have no information. You could try using different bins for flats, heels, sneakers and sandals. That might give you a better idea about your inventory. Or you could further add bins for black heels, white heels and so on. It’s the same principle when choosing bins for a histogram; you want to choose the right amount of bins to give you the information you need.
What is a bin in statistics: Choosing bins
Need help with a homework question? Check out our tutoring page!
Choosing bins can be done by hand for simple histograms in most cases. For example, if you are making a histogram for exam scores, choosing bins that matches grades (70-79, 80-89, 90-100) is a fairly obvious choice. You have two numbers associated with each bin:
- The low value (sometimes called bin low), which in this example would be 70, 80, 90,
- The high value (sometimes called bin high) which for this example is 79 89 100.
In most cases though, choosing bins isn’t going to be that simple especially for large data sets. When dealing with large sets of numbers, you’re usually better off using technology like Microsoft Excel to create a histogram (how to create a histogram in Excel), because if your bin choice doesn’t make for a nice-looking diagram you can dynamically change the bin values without having to draw a graph.
Choose Bin size: Overview
(What is a bin?). There are a few general rules for choosing bins:
- Bins should be all the same size. For example, groups of ten or a hundred.
- Bins should include all of the data, even outliers. If your outliers fall way outside of your other data, consider lumping them in with your first or last bin. This creates a rough histogram —make sure you note where outliers are being included.
- Boundaries for bins should land at whole numbers whenever possible (this makes the chart easier to read).
- Choose between 5 and 20 bins. The larger the data set, the more likely you’ll want a large number of bins. For example, a set of 12 data pieces might warrant 5 bins but a set of 1000 numbers will probably be more useful with 20 bins. The exact number of bins is usually a judgment call.
- If at all possible, try to make your data set evenly divisible by the number of bins. For example, if you have 10 pieces of data, work with 5 bins instead of 6 or 7.
Choose Bin size: Steps
Step 1: Find the smallest and largest data point. If your smallest and/or largest numbers are not whole numbers, go to Step 2. If they are whole numbers, go to Step 3.
Step 2: Lower the minimum a little and raise the maximum a little. For example, 1.2 as a minimum becomes 1, and 99.9 as a maximum becomes 100.
Step 3: Decide how many bins you need using your best guess and using the guidelines listed in the intro paragraph above.
Step 4: Divide your range (the numbers in your data set) by the bin size you chose in Step 3. For example, if you have numbers that range from 0 to 50, and you chose 5 bins, your bin size is 50/5=10.
Step 5: Create the bin boundaries by starting with your smallest number (from Steps 1 and 2) and adding the bin size from Step 4. For example, if your smallest number is 0 and your bin size is 10 you would have bin boundaries of 0, 10, 20…
Tip: If you have a large data set, you may want to use Excel to find the smallest and largest point. Type your data into a single column and then use the “Sort” function or type =MIN(A:A) in a blank cell in a different column (i.e. column B) and then type =MAX(A:A) to get the biggest number.
Choose bin sizes with Sturge’s Rule
Sturge’s rule is another way to choose bin sizes. Although it’s widely used in statistical packages for making histograms, it has been criticized for over-smoothing of histograms (Hyndman, 1995). Therefore it should probably be considered a “Rule of Thumb” rather than an absolute formula with the perfect solution.
The formula is:
where:
K = number of class intervals (bins).
N = number of observations in the set.
log = logarithm of the number.
Examples
For 10 observations in the set, the number of class intervals is:
- K = 1 + 3.322 log(10) = 4.322 ≅ 4
For 55 observations in the set, the number of class intervals is:
- K = 1 + 3.322 log(55) = 6.781 ≅ 7
When to Use Sturge’s Rule
Sturge’s rule works best for continuous data that is normally distributed and symmetrical. It helps us to convert this data into discrete, symmetric, binomial classes. As long as your data is not skewed, using Sturge’s rule should give you a nice-looking, easy to read histogram that represents the data well.
What Sturge’s rule is not much good for is severely skewed, non symmetric data sets, or for an extremely large number of observations. Here you’ll want to use one of the many available alternatives.
Advanced Formulas to Choose Bin Sizes
These alternate formulas are not what you can expected to find in an elementary statistics class; they are not used very often.
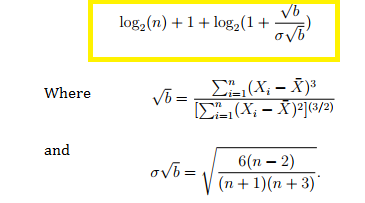
Doane’s rule to Choose Bin Sizes
This modified version of Sturge’s rule may also lead to over-smoothing:
Scott’s Rule
Scott’s rule to choose bin sizes is based on the standard deviation(σ) of the data. The formula is: 3.49σn−1/3.
Rice’s Rule
Rice’s rule is defined as: (cube root of the number of observations) * 2.
For 216 observations, the Rice rule equals 12 (the cubed root of 216 is 6; 6 * 2 = 12).
Freedman-Diaconis’s Rule
This formula uses the interquartile range (IQR):
2(IQR)n−1/3
Choose Bin Sizes: References
Doane, D.P. Aesthetic frequency classification. American Statistician, 30, 181– 183. Retrieved December 13, 2017 from http://www.jstor.org/stable/2683757 December 13, 2017
Gonick, L. (1993). The Cartoon Guide to Statistics. HarperPerennial.
Legg et. al (2013).Improving Accuracy and Efficiency of Mutual Information for Multi-modal Retinal Image Registration using Adaptive Probability Density Estimation.
Hyndman, R. (1995). The problem with Sturges’ rule for constructing histograms. Retrieved December 13, 2017 from: https://robjhyndman.com/papers/sturges.pdf