What is Central Tendency?
Central tendency (sometimes called measure of location, central location, or just center), attempts to describe an entire set of data with one figure — a statistic such as an average amount or a median price.
Central tendency doesn’t tell you specifics about the individual pieces of data, but it does give you an overall picture of what is going on anthe entire data set. There are three major ways to show central tendency: mean, mode and median.
Central Tendency Measures

1. The Mean
The mean is the average of a set of numbers. To find it, add up all the numbers in a set of data and then divide by the number of items in the set. For example, the mean of 2 3 5 9 11 is:
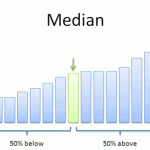
2. The Median
The median is the middle of a set of numbers. Think of it like the median in a road (that grassy area in the middle that separates traffic). To find it, order your data from smallest to largest, then find the center. For example:
1 2 3 4 5 6 7
The median is 4 because it’s in the center, with three numbers either side.
3. The Mode
The mode is the most common number in a set of data. For example, the mode of 1 2 2 3 5 6 is 2.
Some data sets have no mode, like this one: 1 2 3 4 5 6.
Others have multiple modes, like this one — which has two (1 and 3 both appear twice): 1 1 2 3 3.
Outliers and Central Tendency
Outliers are extremely high or extremely low values; they can affect central tendency statistics, especially the mean.
For example, if you got paid three weeks in a row but took vacation in the fourth week, your paychecks might be: $300 $300 $300 $0.
Your four week mean would be ($300 + $300 + $300 + $0) / 4 = $900/4 = $225.
That outlier of zero dollars brought your mean down very low, which isn’t representative of your usual $300 paycheck.
Visualizations
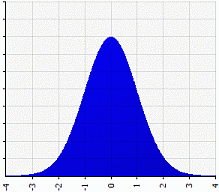
A graph of a distribution can help you to see the central tendency of a set of data.
If a distribution is symmetrical, the mode, median and mean are all in the middle of the distribution. The following graph shows that the mode, median and mean all equal zero:
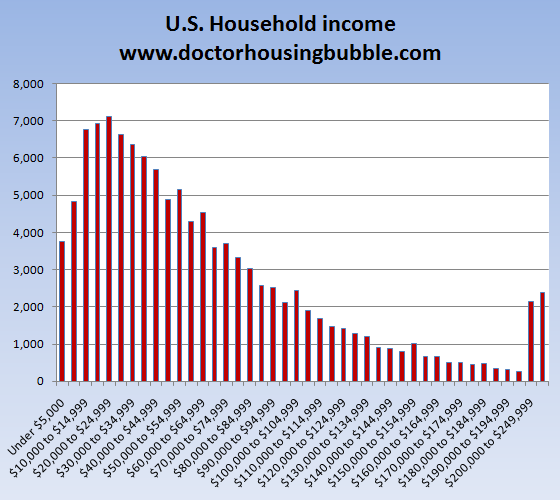
For skewed distributions, which have long “tails” to the left or right, the mode is the most commonly occurring value — and it can be found at the high point of the graph. The median is also the same — it can be found in the center of the distribution. However, the mean is “pulled” in the direction of the tail, so is usually not a good representative for central tendency. Therefore, if your distribution is skewed, the preferred measures of central tendency are the median or mode.
Check out our YouTube channel for hundreds of basic statistics videos!