The Bland-Altman plot (also called the Tukey mean difference plot, RA and MA plots, and various other field-specific names) is an XY scatter plot that compares the disagreement, or differences, between two quantitative measurements. It’s similar to correlation, except that correlation measures the relationship between two variables while the Bland-Altman plot measures the mean differences along with limits of agreement. These limits are calculated using the mean and standard deviation of the differences between the two measurements.
The Bland-Altman plot is not a measure of if the differences between two measurements are acceptable or not. The level of “acceptability” is based on individual circumstances such as biological considerations, clinical necessity, or an understanding of how a particular process works (Giavarina, 2015).
Bland-Altman Graph Example
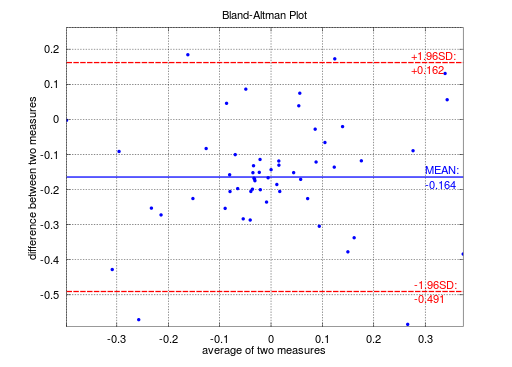
In the above plot:
- Y-axis: the difference between two paired measurements (A-B). For example, this graph could represent 54 different biological specimens measured with two different devices/procedures (“A” and “B”)— each specimen is represented by a single blue dot.
- Blue line: the mean difference. For this plot, the mean difference is -0.164; this tells you that measurement procedure B, on average, differed from procedure A by -0.164.
- Red Line: ±1.96 standard deviations from the mean difference. Bland & Altman recommended that 95% of data points should fall within 2 standard deviations of the mean difference. This 95% confidence level is commonly associated with z-scores of ± 1.96, which is shown on this particular chart.
- X axis: mean of the two measures ((A+B)/2).
References
Bland JM, Altman DG (1986) Statistical method for assessing agreement between two methods of clinical measurement. The Lancet i:307-310. PubMed.
Bland JM, Altman DG (1999) Measuring agreement in method comparison studies. Statistical Methods in Medical Research 8:135-160. PubMed.
Giavarina, D. Biochem Med (Zagreb). 2015 Jun; 25(2): 141–151. Understanding Bland Altman analysis.
Published online 2015 Jun 5. doi: 10.11613/BM.2015.015. PMCID: PMC4470095