Design of Experiments > Balanced and Unbalanced Designs
What are Balanced and Unbalanced Designs?
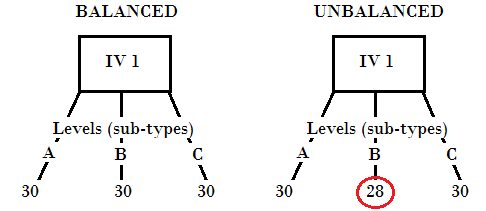
In ANOVA and Design of Experiments, a balanced design has an equal number of observations for all possible level combinations. This is compared to an unbalanced design, which has an unequal number of observations. Levels (sometimes called groups) are different groups of observations for the same independent variable. For example, let’s say you’re taste-testing various cereals. Your levels for “brand of cereal” might be: Lucky Charms, Raisin Bran, or Kellogg’s Cornflakes:
- A balanced design might have 30 boxes of each brand.
- An unbalanced design might have 29 boxes of Lucky Charms, 21 boxes of Raisin Bran, and 30 boxes of Kellogg’s Cornflakes.
In factorial design, a balanced experiment could also mean that the same factor is being run the same number of times for all levels. For example, factors A and B might be run 10 times for two levels.
Balanced vs. Unbalanced Designs in Testing
When performing statistical tests, balanced designs are usually preferred for several reasons, including:
- The test will have larger statistical power,
- The test statistic is less susceptible to small departures from the assumption of equal variances (homoscedasticity).
However, for single factor ANOVA, a lack of balance doesn’t usually affect the results (Milliken and Johnson, 1984).
Even the most carefully planned balanced design could end up being unbalanced. For example:
- Your shipment of Lucky Charms might be delayed.
- A couple of boxes of cereal might be stale and unusable.
- Some of your test subjects might not show up.
If this happens, you should try to turn your design into a nearly-balanced design. There are several ways to do this, including:
- Estimating the missing data. For example, you could use the mean of the observations you do have to “fill in the blank.”
- Adjusting weights. For example, to compensate for a missing box of cereal, you could adjust the weight upwards for the boxes you have left.
References:
Milhken. G. A.. and D. E. Johnson. (1984). Analysis of messy data. Volume 1: designed experiments. Van Nostrand Reinhold. New York, New York. USA. P. 127.