Probability and Statistics > Normal Distribution Contents:
- What is a Normal distribution?
- The Empirical Rule
- Flat Normal Distribution
- The Standard Normal Model
- Normal Distribution Word Problems.
- Probability Density Function
- Related Articles.
What is a Normal distribution?
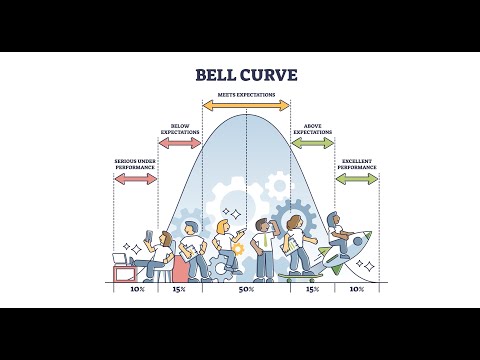
The normal distribution, also called the Gaussian distribution, de Moivre distribution, or “bell curve,” is a probability distribution that is symmetric about its center: half of data falls to the left of the mean (average) and half falls to the right. The bulk of data are clustered around the central mean, which results in a bell-shaped curve when graphed.

A normal distribution occurs naturally in many situations. For example, the normal distribution aka the bell curve, is seen in tests such as the SAT and GRE. The bulk of students will score the average (C), resulting in a “bump” in the middle of the graph. Smaller numbers of students will score a B or D, which means that a graph will start to thin out as you move away from the middle. An even smaller percentage of students score an F or an A, which results in thin tails. This creates a distribution that resembles a bell (hence the nickname). Many other types of data follow this bell-shaped pattern including salaries, measurement errors, heights and weights. That’s why it’s widely used in business and science.
Watch the video for an overview of the normal distribution, or read on below.
Can’t see the video? Click here to watch it on YouTube.
The Empirical Rule
The empirical rule tells you what percentage of your data falls within a certain number of standard deviations from the mean.The standard deviation controls the spread of the distribution. A smaller standard deviation indicates that the data is tightly clustered around the mean, resulting in a taller and thinner normal distribution. A larger standard deviation indicates that the data is spread out around the mean; the normal distribution will be flatter and wider. The empirical rule tells us that: • 68% of data falls within one standard deviation of the mean. • 95% of data falls within two standard deviations of the mean. • 99.7% of data falls within three standard deviations of the mean. 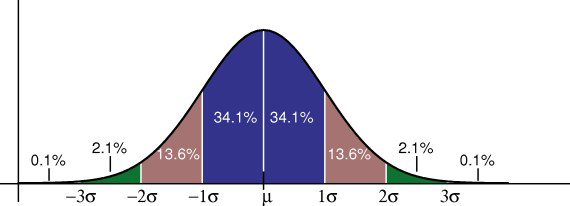
Properties of a normal distribution
- The mean, mode and median are all equal.
- The curve is symmetric at the center (i.e. around the mean, μ).
- Exactly half of the values are to the left of center and exactly half the values are to the right.
- The total area under the curve is 1, or 100%. In other words, the curve represents 100% of all possible data.
Flat Normal Distribution
A flat normal distribution (or flattened Gaussian distribution) is a normal distribution with a large standard deviation. The standard deviation is a measure of spread; smaller values compress the distribution into a smaller space while a larger standard deviation flattens and widens the normal.
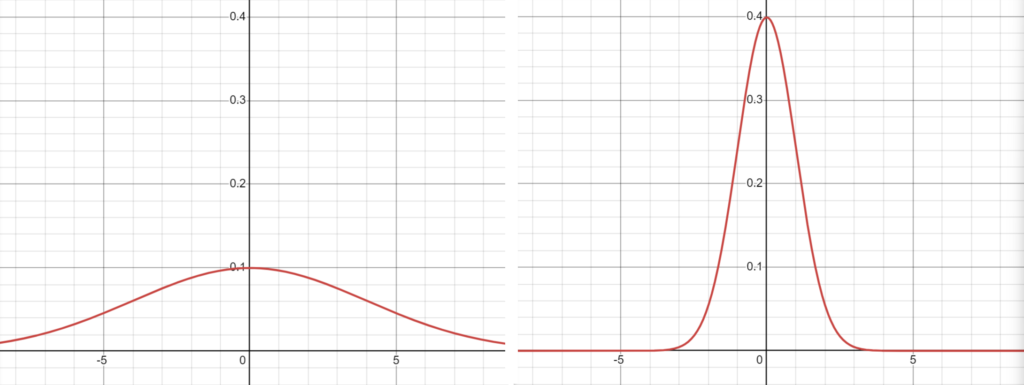
The flat normal distribution also has a high variance, which makes sense because the standard deviation is the square root of variance.
Why use the flat normal?
In some experiments, there may be some uncertainty about where exactly the center of the distribution (e.g., the mean or expected value) lies. This can happen in Bayesian analysis when prior information is scarce or in any experiment where there is a dearth of data. For example, tornado researchers Elsner and Schroder [3] used a combination of a flat normal distribution and a flat Student’s t-distribution for priors on two parameters, because tornado research was, at the time of their 2019 studies, not on a solid statistical foundation (disclaimer: I’m not sure whether that has changed, but tornados are beyond my area of expertise!). Choosing a large value for the variance results in a flat distribution, representing the researcher’s level of uncertainty about the location of the parameter of interest. Sometimes, the flat normal distribution might be referred to as a “slab,” compared to a distribution with a “spike,” which would have a larger variance [4]. Distributions with a spike are sometimes called peaked normal distributions.
Standard Normal Model
A standard normal model is a normal distribution with a mean of 0 and a standard deviation of 1. In the standard normal model, about five percent of your data would fall into the “tails” (colored darker orange in the image below) and 90 percent will be in between. For example, for test scores of students, the normal distribution would show 2.5 percent of students getting very low scores and 2.5 percent getting very high scores. The rest will be in the middle; not too high or too low. The shape of the standard normal distribution looks like this: 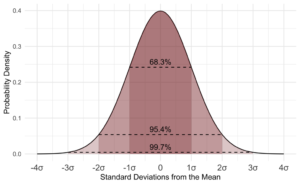
Practical Applications of the Standard Normal Model
The standard normal distribution could help you figure out which subject you are getting good grades in and which subjects you have to put more effort into due to low scoring percentages. Once you get a score in one subject that is higher than your score in another subject, you might think that you are better in the subject where you got the higher score. This is not always true. You can only say that you are better in a particular subject if you get a score with a certain number of standard deviations above the mean. The standard deviation tells you how tightly your data is clustered around the mean; It allows you to compare different distributions that have different types of data — including different means. For example, if you get a score of 90 in Math and 95 in English, you might think that you are better in English than in Math. However, in Math, your score is two standard deviations above the mean. In English, it’s only one standard deviation above the mean. It tells you that in Math, your score is far higher than most of the students (your score falls into the tail). Based on this data, you actually performed better in Math than in English!
Probability Questions using the Standard Model
Questions about standard normal distribution probability can look alarming but the key to solving them is understanding what the area under a standard normal curve represents. The total area under a standard normal distribution curve is 100% (that’s “1” as a decimal). For example, the left half of the curve is 50%, or .5. So the probability of a random variable appearing in the left half of the curve is .5. Of course, not all problems are quite that simple, which is why there’s a z-table. All a z-table does is measure those probabilities (i.e. 50%) and put them in standard deviations from the mean. The mean is in the center of the standard normal distribution, and a probability of 50% equals zero standard deviations.
Standard normal distribution: How to Find Probability (Steps)
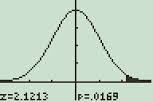
Step 1: Draw a bell curve and shade in the area that is asked for in the question. The example below shows z > -0.8. That means you are looking for the probability that z is greater than -0.8, so you need to draw a vertical line at -0.8 standard deviations from the mean and shade everything that’s greater than that number.

Step 2: Visit the normal probability area index and find a picture that looks like your graph. Follow the instructions on that page to find the z-value for the graph. The z-value is the probability. Tip: Step 1 is technically optional, but it’s always a good idea to sketch a graph when you’re trying to answer probability word problems. That’s because most mistakes happen not because you can’t do the math or read a z-table, but because you subtract a z-score instead of adding (i.e. you imagine the probability under the curve in the wrong direction). A sketch helps you cement in your head exactly what you are looking for. Back to top
Normal Distribution Word Problems
This video shows one example of a normal distribution word problem:

Can’t see the video? Click here to watch it on YouTube.
When you tackle a normal distribution problem in a statistics class, you’re trying to find the area under the curve. The total area is 100% (as a decimal, that’s 1). Normal distribution problems come in six basic types. How do you know that a word problem involves normal distribution? Look for the key phrase “assume the variable is normally distributed” or “assume the variable is approximately normal.” To solve a word problem you need to figure out which type you have.
- “Between”: Contain the phrase “between” and includes an upper limit and lower limit (i.e. “find the number of houses priced between $50K and 200K”).
- “More Than” or “Above”: contain the phrase “more than” or “above”.
- “Less Than”.
- Lower Cut Off Example (video)
1. “Between”
This how-to covers solving problems that contain the phrase “between” and includes an upper and lower limit (i.e. “find the number of houses priced between $50K and 200K”. Note that this is different from finding the “middle percentage” of something.
Word problems with normal distribution: “Between”: Steps
Step 1: Identify the parts of the word problem. The word problem will identify:
- The mean (average or μ).
- Standard deviation (σ).
- Number selected (i.e. “choose one at random” or “select ten at random”).
- X: the numbers associated with “between” (i.e. “between $5,000 and $10,000” would have X as 5,000 and as $10,000).
In addition, you will be given EITHER:
-
- Sample size (i.e. 400 houses, 33 people, 99 factories, 378 plumbers etc.). OR
- You might be asked for a probability (in which case your sample size will most likely be everyone, i.e. “Journeyman plumbers” or “First year pilots.”
Step 2: Draw a graph. Put the mean you identified in Step 1 in the center. Put the number associated with “between” on the graph (take a guess at where the numbers would fall–it doesn’t have to be exact). For example, if your mean was $100, and you were asked for “hourly wages between $75 and $125”) your graph will look something like this:  Step 3: Figure out the z-scores. Plug the first X value (in my graph above, it’s 75) into the z value formula and solve. The μ (the mean), is 100 from the example graph. You can get these figures (including σ, the standard deviation) from your answers in step 1 :
 ![]()
- *Note: if the formula confuses you, all this formula is asking you to do is:
- subtract the mean from X
- divide by the standard deviation.
Step 4: Repeat step 3 for the second X. Step 5: Take the numbers from step 3 and 4 and use them to find the area in the z-table. If you were asked to find a probability in your question, go to step 6a. If you were asked to find a number from a specific given sample size, go to step 6b. Step 6a: Convert the answer from step 5 into a percentage.
-
-
- For example, 0.1293 is 12.93%.
-
That’s it–skip step 6b! Step 6b Multiply the sample size (found in step 1) by the z-value you found in step 4. For example, 0.300 * 100 = 30. That’s it!
2. “More Than” or “Above”
This how-to covers solving normal distribution problems that contain the phrase “more than” (or a phrase like “above”). Step 1: Break up the word problem into parts. Find:
- The mean (average or μ)
- Standard deviation (σ)
- A number (for example, “choose fifty at random” or “select 90 at random”)
- X: the number associated with the “less than” statement. For example, if you were asked to find “under $9,999” then X is 9,999.
Step 2: Find the sample from the problem. You’ll have either a specific size (like “1000 televisions”) or a general sample (“Every television”). Draw a picture if the problem with the mean and the area you are looking for. For example, if the mean is $15, and you were asked to find what dinners cost more than $10, your graph might look like this:  Step 3: Calculate the z-score (plug your values into the z value formula and solve). Use your answers from step 1 :
 ![]() Basically, all you are doing with the formula is subtracting the mean from X and then dividing that answer by the standard deviation. Step 4: Find the area using the z-score from step 3. Use the z-table. Not sure how to read a z-table? See the video on the z-table page. Step 6: Go to Step 6a to find a probability OR go to step 6b to calculate a certain number or amount. Step 6a Turn step 5’s answer into a percentage.
Basically, all you are doing with the formula is subtracting the mean from X and then dividing that answer by the standard deviation. Step 4: Find the area using the z-score from step 3. Use the z-table. Not sure how to read a z-table? See the video on the z-table page. Step 6: Go to Step 6a to find a probability OR go to step 6b to calculate a certain number or amount. Step 6a Turn step 5’s answer into a percentage.
- For example, 0.1293 is 12.93%.
Skip step 6b: you’re done! Step 6b Multiply the sample size from Step 1 by the z-score from step 4. For example, 0.500 * 100 = 50. You’re done!
3. Less Than
This how-to covers solving normal distribution word problems that have the phrase “less than” (or a similar phrase such as “fewer than”).
Normal distribution word problems less than: Steps
Step 1: Break up the word problem into parts:
- The mean (average or μ)
- Standard deviation (σ)
- Number selected (i.e. “choose one at random” or “select ten at random”)
- X: the number that goes with “less than” (i.e. “under $99,000” would list X as 99,000)
Plus, you will have EITHER:
- A specific sample size. For example, 500 boats, 250 sandwiches, 100 televisions etc.
- Everyone in the sample (you’ll be asked to find a probability). For example “first year medical students,” “Cancer patients” or “Airline pilots.”
Step 2: Draw a picture to help you visualize the problem. The following graph shows a mean of 15, and an area “under 4”):  Step 3: Find the z value by plugging the given values into the formula. The “X” in our sample graph is 4, and the μ (or mean) is 15. You can get these figures (including σ, the standard deviation) from your answers in step 1, where you identified the parts of the problem:
 ![]() All you have to do to solve the formula is:
All you have to do to solve the formula is:
- Subtract the mean from X.
- Divide by the standard deviation.
Step 4: Take the number from step 3, then use the z-table to find the area. Step 5:To find a probability, go to step 6a. To find a number from a specific given sample size, go to step 6b. Step 6a Change the number from step 5 into percentage.
- For example, 0.1293 is 12.93%.
That’s it! Step 6b Multiply the sample size (found in step 1) by the z-value you found in step 4. For example, 0.300 * 100 = 30. That’s it!
4. Lower Cut Off
Sometimes on a normal distribution word problem you’ll be asked to find a “lower limit of an upper percentage” of something (i.e. “find the cut-off point to pass a certain exam where the upper 40% of test takers pass”). A lower cut off point is the point where scores will fall below that point. For example, you might want to find where the cut off point is for the bottom 10% of test takers.
Normal Distribution TI 89 Examples
In elementary statistics, you’ll often be faced with a question that asks you the cut off points for a certain percentage of the normal distribution, like the top 90% or the top 10%. While working out these types of problems by hand is cumbersome, the TI-89 graphing calculator makes light work of finding cut off points for a top percentage with the Inverse Normal function. What you’re actually doing is looking for the cut off points for a certain percentile: for example, if you have a list of grades and you want to know what score is at the 99th percentile, you can use the inverse normal function to find that percentage cut-off point.
1. Finding Cut Off Points For a Top Percentage
Example problem: Students at a certain college average 5 feet 8 inches (68 inches) tall. The heights are normally distributed, with a standard deviation of 2.5 inches. What is the value that separates the top 1% of heights from the rest of the population? Step 1: Press APPS and use the scroll keys to highlight Stats/List Editor. Step 2: Press F5 2 1 (this gets you to the Inverse Normal screen). 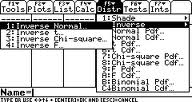 Step 3: Enter 0.99 in the Area box. Step 4: Enter 68 in the μ box. Step 5: Enter 2.5 in the σ box. Step 6: Press ENTER. Step 7: Read the results: Inverse=73.8159 means that the cut off height for the 99th percentile is 73.8159 inches. That’s it! Back to top
2. Probability Proportion Example (NormalCDF function)
Example question: A group of students with normally distributed salaries earn an average of $6,800 with a standard deviation of $2,500. What proportion of students earn between $6,500 and $7,300? Step 1: Press APPS. Scroll to the Stats/List Editor and press ENTER. Step 2: Press F5 4. Step 3: Enter 6500 in the lower value box. Step 4: Enter 7300 in the upper value box. Step 5: Enter 6800 in the μ box. Step 6: Enter 2500 in the σ box. Press ENTER. Step 7: Read the answer. Cdf=.127018. In other words, .013, or 13% of students earn between $6,500 and $7,300.
TI-89 Graphing a Normal Distribution Curve
The TI-89 can not only calculate z-scores and return values for normal distributions, it can graph the normal distribution curve as well. Graphing a normal distribution can help you see what it is you are supposed to be looking for, and gives you one more tool in solving normal distribution problems. The TI-89 can graph a normal distribution curve with an area shaded for any value. For example, you could create a graph that is: less than a certain number, greater than a certain number, or in-between a certain set of numbers. Example problem: Draw a normal distribution curve for student salaries during a typical semester. The student salaries have a mean of $6,800 and standard deviation of $2,500. Shade the area on the graph that corresponds to salaries between $7,300 and $9,000. Step 1: Press APPS and select the Stats/List Editor. 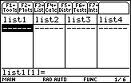 Step 2: Press F2 3 and F2 4. Step 3: Press F5 ) 1. Step 4: Scroll down and enter 7300 in the lower value box. Step 5: Scroll down and enter 9000 in the upper value box. Step 6: Scroll down and enter 6800 in the μ box. Step 7: Scroll down and enter 2500 in the σ box. Step 8: Scroll down. Turn Auto Scale to “yes” by pressing the right scroll key, then the down scroll key to select yes. Press ENTER.
That’s it! Tip: If you want to enter ∞ (infinity) as one of your lower or upper values, press the diamond key and then Catalog.
Normal Distribution Problems using Excel
While it’s possible to look up probabilities for a normal distribution using the z-table, it’s much easier to calculate probabilities in Excel for a couple of reasons. First, there’s no looking at a table; the NORMDIST function does the hard work for you. Second, Excel does the intermediate calculations for you. Most calculation errors happen in an intermediate step (such as calculating the z-score to look up) rather than the actual z-score itself. Excel can handle three types of probability calculations: more than, less than, and in between. These instructions work for Excel 2007 and Excel 2010. Example Question: Suppose that a contaminant in samples from a city’s water supply has a mean of 500 ppm and a standard deviation of 100 ppm. What is the probability that bacteria in a randomly selected water sample will be: 1/ less than 600 ppm 2/More than 600 ppm 3/between 400 and 600 ppm?
Calculate Normal Distribution Probability in Excel: Less than
Step 1: Click an empty cell. Step 2: Click “Insert Formula”. Step 3: Type “Normdist” into the search box and then click “Go.” Step 4: Select “NORMDIST” from the list and then click “OK” to open the Function Arguments window. Step 5: Enter your data into the box. For this example, type “600” in the X box, “500” in the Mean box, “100” in the Standard Deviation box and “true” in the cumulative box.. Step 6: Click “OK.”. This returns 0.84134474 in the cell you clicked in Step 1, which is the probability of getting under 600 ppm.
Calculate Normal Distribution Probability in Excel: More than
Step 7: Subtract your answer from Step 7 (above) from 1: 1-0.84134474= 0.158653.
Calculate Normal Distribution Probability in Excel: Between
Step 8: Repeat Steps 1 through 8 for the second value, which for this example is 400. The probability is 0.15865526. Step 9: Subtract the larger probability from the smaller probability. In this example: 0.84134474 – 0.15865526 = 0.68269 That’s it!
Probability Density Function
The normal distribution is formally defined by the probability density function:
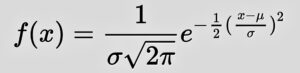
Where:
- μ and σ are fixed constants.
- ex = Exponential function [6].
References
-
- D Wells, CC BY-SA 4.0, via Wikimedia Commons
- Graph created with Desmos.
- Elsner, J. & Schroder, Z. (2019). Tornado damage ratings estimated with cumulative logistic regression. Retrieved March 3, 2023 from: https://eartharxiv.org/repository/object/782/download/1727/
- Walli, G. (2010). Bayesian Variable Selection in Normal Regression Models. Thesis.
- Brewerton, F. (1973). Variability assumptions and their effect on capital investment risk.
- Kjos-Hannsen, B. (2019) Statistics for Calculus Students. Retrieved April 30, 2021 from: https://dspace.lib.hawaii.edu/handle/10790/4572
Related Articles
- What is the 68-95-99.7 Rule?
- Box Cox Transformation
- Box Muller Transform
- Gaussian Mixture Models.
- What is a Normal Probability Plot?
- How to Calculate a Z-Score in Statistics
- Find the area to the right of a z score.
- Using the Normal Approximation to solve a Binomial Problem
- What is the continuity correction factor?
- Area Under a Normal Distribution Curve Index
- Central Limit Theorem.
- The Skew Normal Distribution.
- Two Tailed Normal Curve.
- The Q Function.