- What is the Central Limit Theorem?
- Central Limit Theorem Examples: Step by step with video clips
- Central Limit Theorem on the TI 89
- TI 83 Central Limit Theorem (video)
What is the Central Limit Theorem?
The Central Limit Theorem states that the sampling distribution of the sample means approaches a normal distribution as the sample size gets larger — no matter what the shape of the population distribution. This fact holds especially true for sample sizes over 30.
All this is saying is that as you take more samples, especially large ones, your graph of the sample means will look more like a normal distribution.
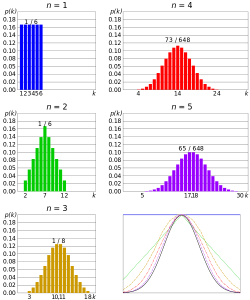
Here’s what the Central Limit Theorem is saying, graphically. The picture below shows one of the simplest types of test: rolling a fair die. The more times you roll the die, the more likely the shape of the distribution of the means tends to look like a normal distribution graph.
The Central Limit Theorem and Means
An essential component of the Central Limit Theorem is that the average of your sample means will be the population mean. In other words, add up the means from all of your samples, find the average and that average will be your actual population mean. Similarly, if you find the average of all of the standard deviations in your sample, you’ll find the actual standard deviation for your population. It’s a pretty useful phenomenon that can help accurately predict characteristics of a population. Watch a video explaining this phenomenon, or read more about it here: The Mean of the Sampling Distribution of the Mean.
Definition using Calculus
If you’ve taken some calculus, you can define the CLT more precisely using the definition of a limit. The CDF of the standardized sample mean (X̄ – μ)/σ converges pointwise to the CDF (Φ) of the standard normal distribution. This is shown with the integral:
![]()
Where:
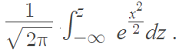
Note: An assumption is that the expected value of X and X2 < infinity.
Central Limit Theorem Examples
Need help with a homework question? Check out our tutoring page!
A Central Limit Theorem word problem will most likely contain the phrase “assume the variable is normally distributed”, or one like it. With these central limit theorem examples, you will be given:
- A population (i.e. 29-year-old males, seniors between 72 and 76, all registered vehicles, all cat owners)
- An average (i.e. 125 pounds, 24 hours, 15 years, $15.74)
- A standard deviation (i.e. 14.4lbs, 3 hours, 120 months, $196.42)
- A sample size (i.e. 15 males, 10 seniors, 79 cars, 100 households)
Click the link to skip down to one of three central limit theorem examples:
- I want to find the probability that the mean is greater than a certain number
- I want to find the probability that the mean is less than a certain number
- I want to find the probability that the mean is between a certain set of numbers either side of the mean
Central Limit Theorem Examples: Greater than
For Central Limit Theorem word problems that contain the phrase “greater than” (or a similar phrase such as “above”).
1. General Steps
Step 1: Identify the parts of the problem. Your question should state:
- the mean (average or μ)
- the standard deviation (σ)
- population size
- sample size (n)
- a number associated with “greater than” (
 ). Note: this is the sample mean. In other words, the problem is asking you “What is the probability that a sample mean of x items will be greater than this number?
Step 2: Draw a graph. Label the center with the mean. Shade the area roughly above ![]() (i.e. the “greater than” area). This step is optional, but it may help you see what you are looking for.
(i.e. the “greater than” area). This step is optional, but it may help you see what you are looking for.

Step 3: Use the following formula to find the z-score. Plug in the numbers from step 1.

Click here if you want easy, step-by-step instructions for solving this formula.
- Subtract the mean (μ in step 1) from the ‘greater than’ value (in step 1). Set this number aside for a moment.
- Divide the standard deviation (σ in step 1) by the square root of your sample (n in step 1). For example, if thirty six children are in your sample and your standard deviation is 3, then 3 / √36 = 0.5
- Divide your result from step 1 by your result from step 2 (i.e. step 1/step 2)
Step 4: Look up the z-score you calculated in step 3 in the z-table. If you don’t remember how to look up z-scores, you can find an explanation in step 1 of this article: Area to the right of a z-score.
Step 5: Subtract your z-score from 0.5. For example, if your score is 0.1554, then 0.5 – 0.1554 = 0.3446.
Step 6: Convert the decimal in Step 5 to a percentage. In our example, 0.3446 = 34.46%.
That’s it!
2. Specific Example
Q. A certain group of welfare recipients receives SNAP benefits of $110 per week with a standard deviation of $20. If a random sample of 25 people is taken, what is the probability their mean benefit will be greater than $120 per week?
Step 1: Insert the information into the z-formula:
= (120-110)/20 √25 = 10/ (20/5) = 10/4 = 2.5.
Step 2: Look up the z-score in a table (or calculate it using technology). A z-score of 2.5 has an area of roughly 49.38%. Adding 50% (for the left half of the curve), we get 99.38%.
Back to top for more Central Limit Theorem Examples
Central Limit Theorem Examples: Less than
Solving Central Limit Theorem word problems that contain the phrase “less than” (or a similar phrase such as “lower”).
1. General Steps
Step 1: Identify the parts of the problem. Your question should state:
- the mean (average or μ)
- the standard deviation (σ)
- population size
- sample size (n)
- a number associated with “less than” ( )
Step 2: Draw a graph. Label the center with the mean. Shade the area roughly below ![]() (i.e. the “less than” area). This step is optional, but it may help you see what you are looking for.
(i.e. the “less than” area). This step is optional, but it may help you see what you are looking for.

Step 3: Use the following formula to find the z-score. Plug in the numbers from step 1.
Click here if you want simple, step-by-step instructions for using this formula.
If formulas confuse you, all this formula is asking you to do is:
- Subtract the mean (μ in step 1) from the less than value ( in step 1). Set this number aside for a moment.
- Divide the standard deviation (σ in step 1) by the square root of your sample (n in step 1). For example, if thirty six children are in your sample and your standard deviation is 2, then 3 / √ 36 = 0.5
- Divide your result from step 1 by your result from step 2 (i.e. step 1/step 2)
Step 4: Look up the z-score you calculated in step 4 in the z-table. If you don’t remember how to look up z-scores you can find an explanation in step 1 of this article on area to the right of a z-score in a normal distribution curve.
Step 5: Add your z-score to 0.5. For example, if your z-score is 0.1554, then 0.5 + 0.1554 is 0.6554.
Step 6: Convert the decimal in Step 6 to a percentage. In our example, 0.6554 = 65.54%.
That’s it!
2. Specific Example
A population of 29 year-old males has a mean salary of $29,321 with a standard deviation of $2,120. If a sample of 100 men is taken, what is the probability their mean salaries will be less than $29,000?
Step 1: Insert the values into the z-formula:
= (29,000 – 29,321) / (2,120/√100) = -321/212 = -1.51.
Step 2: Look up the z-score in the left-hand z-table (or use technology). -1.51 has an area of 93.45%.
However, this is not the answer, as the question is asking for LESS THAN, and 93.45% is the area “greater than” so you need to subtract from 100%.
100% – 93.45% = 6.55% or about 0.07.
Back to top for more Central Limit Theorem Examples
Central Limit Theorem Examples: Between
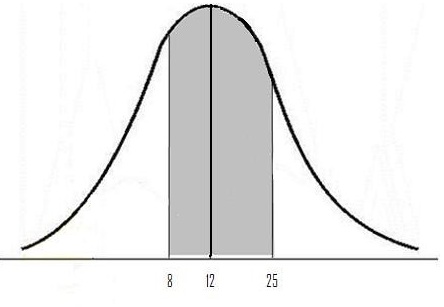
Example problem: There are 250 dogs at a dog show who weigh an average of 12 pounds, with a standard deviation of 8 pounds. If 4 dogs are chosen at random, what is the probability they have an average weight of greater than 8 pounds and less than 25 pounds?
Step 1:Identify the parts of the problem. Your question should state:
- mean (average or μ) standard deviation (σ) population size
- sample size (n)
- number associated with “less than” 1
- number associated with “greater than” 2
Step 2: Draw a graph. Label the center with the mean. Shade the area between 1 and 2. This step is optional, but it may help you see what you are looking for.
Step 3: Use the following formula to find the z-scores.
All this formula is asking you to do is:
a) Subtract the mean (μ in Step 1) from the greater than value (Xbar in Step 1): 25 – 12 = 13.
b) Divide the standard deviation (σ in Step 1) by the square root of your sample (n in Step 1): 8 / √ 4 = 4
c) Divide your result from a by your result from b: 13 / 4 = 3.25
Step 4 Use the formula from Step 3 to find the z-values. This time, use Xbar2 from Step 1 (8).
a) Subtract the mean (μ in Step 1) from the greater than value (Xbar in Step 1): 8 – 12 = -4.
b) Divide the standard deviation (σ in Step 1) by the square root of your sample (n in Step 1): 8 / √ 4 = 4
c) Divide your result from a by your result from b: -4 / 4= -1
Step 5: Look up the value you calculated in Step 3 in the z-table.
Z value of 3.25 corresponds to .4994
Step 6: Look up the value you calculated in Step 4 in the z-table.
Z value of 1 corresponds to .3413
Note that the bell curve is symmetrical, so if you want to look up a negative value like -1, then just look up the positive counterpart. The area will be the same.
Step 7: Add Step 5 and 6 together:
.4994 + .3413 = .8407
Step 8: Convert the decimal in Step 7 to a percentage:
.8407 = 84.07%
That’s it!
Back to top for more Central Limit Theorem Examples
Central Limit Theorem on the TI 89
Example problem: A population of community college students includes inner city students (p = .33). What is the probability that a random sample of 45 students from the population will have from 20% to 40% inner city students?
Step 1: Press APPS. Highlight the Stats/List Editor by using the scroll keys. Press ENTER.
If you don’t see the Stats/List editor you need to load the app. See instructions here.
Step 2: Press F5 and scroll down to C: BinomialCdf.
Step 3: Enter 45 in the Num Trials box.
Step 4: Scroll down and enter .33 in the Prob Success box.
Step 5: Scroll down and enter 9 in the Lower Value box (because 20% of 45 = 9).
Step 6: Scroll down and enter 18 in the Upper Value box (because 40% of 45 = 18). Press ENTER.
Step 7: Read the Result: Cdf = .857142. This means that the probability your random sample will have 20 – 40% inner city students is 85.71%.
TI 83 Central Limit Theorem: Overview
The TI 83 calculator has a built in function that can help you calculate probabilities of central theorem word problems, which usually contain the phrase “assume the distribution is normal” (or a variation of that phrase).
The function, normalcdf, requires you to enter a lower bound, upper bound, mean, and standard deviation.
Example problem: A fertilizer company manufactures organic fertilizer in 10 pound bags with a standard deviation of 1.25 pounds per bag. What is the probability that a random sample of 15 bags will have a mean between 9 and 9.5 pounds?
Step 1: 2nd VARS 2.
Step 2: Enter your variables (lower bound, upper bound, mean, and standard deviation). Separate each variable by a comma: 9,9.5, 10,(1.25/√15)).
Step 3: Press ENTER. This returns the probability of .05969, or .05969%.
Tip:If you have a question that asks for “greater than” or “less than” a certain number, enter 999999999 for the lower or upper bound. For example, if you wanted to know the probability of greater than 8 pounds you would enter:
NORMALCDF(8,999999999,10,1./√(15))
Less than 8 pounds you would enter:
NORMALCDF(999999999,8,10,1./√(15))
Tip: Sampling distributions require that the standard deviation of the mean is σ / √(n), so make sure you enter that as the standard deviation.
Check out our statistics YouTube channel for more tips and central limit theorem examples!
References
Gonick, L. (1993). The Cartoon Guide to Statistics. HarperPerennial.
Kotz, S.; et al., eds. (2006), Encyclopedia of Statistical Sciences, Wiley.